|
|
Online help | Advanced USB Port MonitorAbout softwareAdvanced USB Port Monitor is USB bus, USB device and protocol analyzer software. Advanced USB Port Monitor packs the robust functionality that customers have come to capture, view and process USB traffic. It offers sophisticated viewing and intelligent searching to accurately and efficiently debug and test High (480Mbps), Full (12Mbps) and Low (1.5Mbps) speed USB devices and software.
Advanced USB Port Monitor design enables users to use it with any USB device, extending beyond the lab environment over to the personal workstations of USB developers and advanced USB device's users. Most users - USB hardware and software developers, advanced users - will appreciate the value and benefit of having a personal USB monitor and analyzer tool to fit their individual needs.
Advanced USB Port Monitor can be used as a "sniffer" and does not affect on traffic between the host and device or software and host.
The Advanced USB Port Monitor software allows you to display the packets sent, decode the descriptors, detect errors in peripherals or drivers, and measure device and driver performance. When capturing the packets, the real-time statistical display permits you to check the bus status, even before you look at the packets that have been read. These are displayed in a chronological list together with the peripheral's address and the endpoint number. To make it easier to identify the packets you are interested in the software provides filtering and packet color coding functions. It also gives the user the choice of several levels of detail, and the information taken from the traffic contains references to the USB specification.
Key features
•Faster interpretation and debug of USB traffic; •Kernel driver technology and supports: WDM, WMI, Power Management, PNP, etc.; •Capable of capturing all USB speeds (USB 2.0 too); •Real-Time monitoring and logging (view device traffic as it occurs); •Configurable filtering - automatically exclude non-essential and redundant packets from the monitoring; •Sophisticated viewing - view URB packets of the USB protocol and IRPs of PnP system, Power management system etc; •View, explore and browse USB Devices and their related devices such as USB Drives; •View detailed information about USB device (interfaces, endpoints, registry information, class information, etc - 2 pages report!); •View and process USB traffic; •Tool tips for text in the monitor window; •View detailed information about each URB or IRP; •Print all information (USB traffic, devices information, etc); •Measure the performance of your USB devices; •Stop and fast replug USB devices; •Color highlighting; •Customizable data views; •User-defined workspaces; •Multiply monitoring windows (MDI interface); •Export functions (PDF, XML, Microsoft Word documents).
Our Advanced USB Port Monitor has a simple, menu-driven step by step set-up. Programming is not required to configure the software to collect data from and control most serial devices.
It is extremely easy to use! The configuration process is fully menu driven and has complete, context sensitive, on-line help. Once you see how easy it is to use Advanced USB Port Monitor, you will use our software again and again.
DISCLAIMER:
Company home page: https://www.aggsoft.com/ Software home page: https://www.aggsoft.com/usb-port-monitor.htm USB port hardware reference: https://www.aggsoft.com/usb-pinout-cable/
GlossaryBinary file - A file that contains data or program instructions written in ASCII and extended ASCII characters.
ASCII - An acronym for American Standard Code for Information Interchange. ASCII files are plain, unformatted text files that are understood by virtually any computer. Windows Notepad and virtually any word processor can read and create ASCII files. ASCII files usually have the extension .TXT (e.g., README.TXT).
Bytes - A collection of eight bits that represent a character, letter or punctuation mark.
USB (Universal Serial Bus) - a "plug and play" interface between a computer and peripherals (like audio players, digital cameras, joysticks, keyboards, and printers), which lets you plug in a device without adding an adapter card or even restarting your PC. Its speed makes it ideal for music and digital photo transfer. USB 1.1, the familiar USB standard of the last several years, supports a data transfer speed of 12 Mbps (megabits per second) — significantly faster than a serial connection. But new USB 2.0 standard is dramatically faster — 480 Mbps! Today, most new computers (both IBM-compatible PCs and Macs) and many peripheral devices are equipped with USB; for example, USB support is integrated into Windows® 98, 98SE, 2000, 2000SE, ME and Windows XP, as well as Mac OS 8.6 and up. All new computers equipped by high-speed USB 2.0 interface.
ACK - Handshake packet indicating a positive acknowledgement between devices or a host and device on the USB bus.
Active device - A device that is not in the suspended state and is powered on.
Asynchronous data - data that is sent across the USB bus without regard to timing requirements, the opposite to isochronous.
Babble - Persistent data on the bus that is not expected by any device or host.
Bandwidth - The amount of data that can be transmitted over the bus in a given amount of time. Usually expressed in bits per second (bps).
Bit - A single element within the computer (or on the bus) that is either a 1 or 0. There are eight bits in a byte of data.
Buffer - Temporary storage are used by the computer (or USB device) to put data when it cannot be immediately used.
Bulk transfer - Movement of large blocks of data across the USB bus that is not time critical (i.e. a large asynchronous transfer).
Bus enumeration - The process of detecting and identifying USB devices.
Byte capabilities - The functional parameters of a device that can be controlled by the host software.
Characteristics - Functionality within the USB device that is not changeable by the host software.
Client - The software on the host that is the highest level user of the USB device.
Control pipe - A pipe used to send configuration and control information from the host computer to a device on the USB bus.
Control transfer - A transfer over the control pipe from the host computer to a device on the USB to provide configuration and control information to a USB device.
CRC - Cyclic redundancy check; used to detect errors in the transmission of data across the bus. The CRC is transmitted along with the data packets for comparison with a CRC calculated by the receiving device.
Default address - The address that a USB device responds to before the host software sets the desired address on the device.
Default pipe - A message pipe created by the host system software to exchange control and status information with the USB device's endpoint zero.
Device - A logical or physical entity that performs a function. The actual entity described depends on the context of the reference. Usually referring to the device attached to the USB bus.
Device address - The address of a device on the USB bus. The address is the default address when the USB device s first powered or reset. Hubs and functions are assigned a unique device address by the USB host software.
Device endpoint - A uniquely identifiable portion of a USB device that is the source or sink of information in a communication flow between the host and device.
Downstream - The direction of data flow from the host.
Driver - A program responsible for interfacing to a hardware device, i.e. device driver.
Interrupt transfer - USB Interrupt data is typically small packets of data that are used by the USB device to send status information to the computer.
Isochronous transfer - one of four USB transfer types. Isochronous transfers are used when working with isochronous data. Isochronous transfers provide periodic, continuous communication between hosts and device.
Upstream - The direction of data flow to the host. System requirementsProcessor: Any Intel® x86 compatible CPU
Operating system: •Windows 2000; •Windows XP (all editions) (both x86 and x64); •Windows 2003 Server (both x86 and x64); •Windows Vista (both x86 and x64).
The program doesn't work under Windows 9x,Me and NT!
USB controllers and ports: At least (1) USB 1.1 or 2.0 Controller
CPU speed: Recommended 1 GHz or faster – our software may run successful on certain slower CPUs but because of Windows overhead, performance test results will not be as accurate.
Memory: Recommended 256 MB.
Free disk space: Recommended at least 100 MB of extra disk space. Advanced USB Port Monitor takes up about 10 MB but additional space required for log files.
Special login requirements: You must be logged on as a user with Administrator privileges to run our software. It is necessary for access certain registry keys and write special filter driver registry entries.
Vista notes:
Because our software uses a kernel-mode driver for capturing an USB data, therefore:
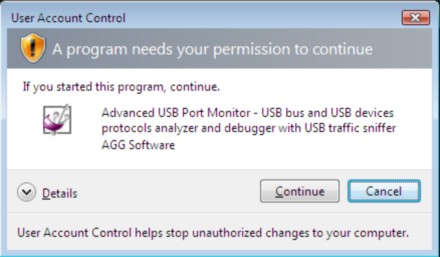
1.You need administrator privileges to run our software; 2.The desktop icon of our software will contain a shield (pic.1); 3.Windows Vista will ask your permission to continue (pic.2).
Pic.1. Desktop icon on Windows Vista
Pic.2. User Account Control dialog
You may disable User Account Control manager and you'll never see the dialog above. Please, search Google for an solution. Installation processIf any beta-version was installed on your computer, remove it.
Quit of the working Advanced USB Port Monitor before installation.
Run an installation file.
By default, Advanced USB Port Monitor will be installed to the directory"/Programs Files/Advanced USB Port Monitor" of your system disk, but you can change this path.
IntroductionUSB OverviewUSB, or Universal Serial Bus, is a connectivity standard that enables computer peripherals to be connected to a computer without reconfiguring the system or opening the computer box to install interface cards. USB was introduced in 1995 and replaces the serial, parallel, mouse and keyboard ports. The host computer automatically recognizes the device and installs the appropriate drivers. It is a fast, bi-directional, low-cost, dynamically attachable serial interface that was visualized to provide ease of connectivity to PCs. With features such as high speed and hot "pluggability", USB has become a de-facto standard for various consumer and peripheral devices. USB connectivity standard allows up to 127 devices connected to a Host System. The current standards of USB allow data transfer rates of 1.5 Mbps, 12 Mbps and recently 480 Mbps. USB enables low, medium and high-speed connectivity between computers and peripheral devices, including keyboards, mice, printers, scanners, joysticks and cameras, using plug and play technology. Hi-Speed USB extends the speed of the connection from 12 Mbps on Original USB up to 480 Mbps on Hi-Speed USB, providing an attachment point for next-generation peripherals which complement higher performance PCs and user applications. Hi-Speed USB is both forward and backward compatible with Original USB, resulting in a seamless transition process for the end user. In fact, Hi-Speed USB uses the same cables and connectors as Original USB. Hi-Speed USB offers a compelling opportunity for peripherals vendors to migrate their USB peripherals to higher performance, while still being able to sell the same peripherals into the huge installed base of USB-capable PCs. Hi-Speed USB is also expected to lead to the development of higher performance peripherals that will bring new applications to the PC.
Why USB?USB emerged in late 1995 from the shortcomings of peripheral devices implementation. Shortly after its introduction, USB became widely popular and is now the clear ubiquitous connectivity in PCs and peripheral devices. USB continues to be dominant for the following reasons:
•Mature, proven technology; •Backward-compatible; •Easy plug and play.
As evidenced by USB popularity, several extensions of the technology have been introduced recently to try and capitalize on its installed base/ popularity. An example of this extension, which is supported and approved by the USB Implementers Forum (USB-IF), is USB On-The-Go (OTG). In addition, several products that have traditionally been 1394-based such as digital camcorders are now coming to market with USB 2.0.
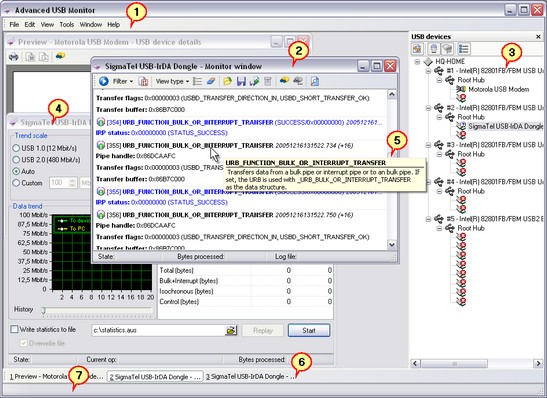
Features & Benefits•Ubiquitous PC and peripheral connectivity today; •Seamless forward/backward compatibility between USB 1.1 and USB 2.0 devices; •Enables plug n' play and "hot-swapping", thus no need for messy configurations and for users to stop or restart the PC to connect a USB device; •Allows for easy expansion, a single USB port is able to support up to 127 devices; •Mixed peripheral support for varying bandwidth rates of 1.5,12,480 Mbps. User InterfaceThe interface of the program makes it possible to work simultaneously with multiple active windows. It provides maximum convenience in your work with the program. You can use one window to watch the data flow and another one to open detailed information about the device or a data packet. Open windows, their positions and statuses are defined in your workspace that you can save and load. You can see the main elements of the program in fig.1.
Fig.1 Program window
1.Main menu - contains items for quick access to all main functions of the program; 2.Monitor window - allows you to monitor the traffic transferred between the host and the device; 3.USB devices window - shows all connected devices; 4.Performance monitor window - allows you to evaluate the performance of your device during a data transfer; 5.A tooltip in the monitor window; 6.Taskbar - shows the titles of all windows open in your workspace; 7.Status bar - shows a hint for each interface element when the mouse pointer is over it or in some cases shows the progress of some operation.
You will find more detailed descriptions of these interface elements in next sections.
There are three ways to open the window you need.
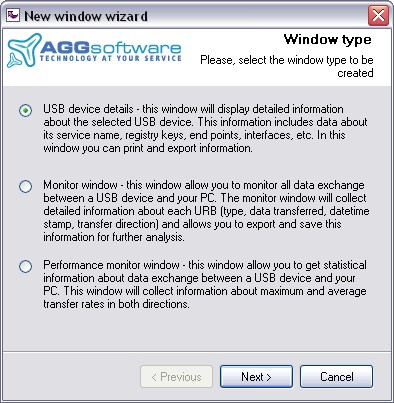
Method 1. Using the New window wizardIt is recommended to use it while you are getting acquainted with the program. Contains a step-by-step instruction how to configure a window of each type. To open the wizard, select the File | New menu item. In this case you will see the window displayed in fig.2.
Fig.2 New window wizard
Select the type of the window you are creating and click the Next button. Follow the instructions of the wizard to select the device, configure filtering and specify the name of the log file where it is necessary.
Method 2. Using the context menuYou can use this method in your everyday work when you are already familiar with the interface of the program. To open the window you need, you should select the device in the list of USB devices [3] and right-click it (you can also open this menu using the Tools item in the main menu). Select the type of the window you want to open in the context menu. It will open the window with the default parameters. You will have to customize the new window.
Method 3. Loading a workspaceYou can use this method in your everyday work when you are already familiar with the interface of the program. It is recommended to save your workspace in case you need to restore several windows. The procedure of working with workspaces is described in the corresponding section.
Toolbars, the menu and the USB devices window are made moveable for your convenience. In order to move an interface element to a new location, you should press and hold down the left mouse button on the title bar of the element or on the vertical line to the left of it (for the toolbar) and move the interface element to its new location. Main menuFile menuFile | New (Ctrl+N) - the command opens the New window wizard.
File | Open (Ctrl+O) - the command allows you to open a binary Advanced USB Port Monitor log file created for some device earlier. The Monitor window will be created for this device. However, if the device is not connected at the moment, it will be impossible to continue logging to this log file.
File | Save (Ctrl+S) - this menu item becomes available only if the Monitor window is active at the moment and allows you to specify a new name for the binary log file. You will be offered to enter the file name in a separate dialog box. If another log file was open before that, you will be offered to copy its contents to the new file.
File | Save as - this menu item becomes available only if the Monitoring window is active at the moment and allows you to save part of data (you should select several data packets in the Monitoring window) or all data in the Monitor window to a binary log file or to an XML file. Before the data is saved, you will have to specify the type of the file and its name in a separate dialog box.
File | Close - this menu item becomes available only if some window is currently active in the program and allows you to close the active window.
File | Close all - this menu item becomes available only if there are any open windows in the program and allows you to close all open windows with one mouse click.
File | Open a workspace - the command opens the dialog box with the list of workspaces. You can find more details about this and other commands concerning workspaces in the Workspace section.
File | Save the workspace - the command becomes available only if some workspace is loaded and allows you to save all changes made in the workspace.
File | Save the workspace as - the command allows you to save the workspace under a new name.
File | Delete workspaces - the command opens the dialog box with the list of workspaces that you can delete.
File | Open a workspace from a file - the command opens the dialog box where you can select any file with a workspace on the disk.
File | Save the workspace to a file - the command opens the dialog box where you can specify the path and the name of the file to save the workspace to on the disk.
File | Open the last workspace on startup - this option specifies that next time the program is started, the last active workspace should be loaded. If no workspace has been used yet, the option is ignored when the program is started.
File | Print - this menu item becomes active only if the Information window is currently active (information about a device, about URB, etc.) and prints the contents of this window with the current print settings.
File | Print setup - the command opens the standard Print Settings dialog box. Further on, these parameters will be used when the Print command is selected.
File | Exit - the command allows you to exit the program. The position of the main program window will be saved when you exit the program.
Edit menuEdit | Copy (Ctrl+C) - this menu item becomes available only if the Monitor window is currently active and one or several data packets are selected there. The command copies the selected items to the clipboard.
Edit | Select all (Ctrl+A) - this menu item becomes available only if the Monitor window is currently active and there is al least one data packet in it. The command selects all data packets. After that you can either copy these data packets to the clipboard or save them to a file.
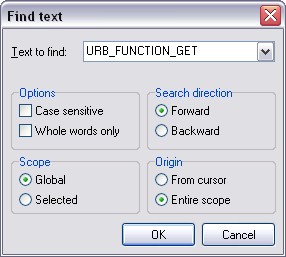
Edit | Find (Ctrl+F) - this menu item becomes available only if the Monitor window is currently active and allows you to search for text in the window. After you select this command, you will see a dialog box (fig.1) where you can specify search parameters.
Fig.1 Search parameters dialog box
Text to find - the text that is to be found;
Options - here you specify the parameters of the search string
•Case sensitive - take into account the difference between lowercase and uppercase letters while searching; •Whole words only - search for whole words only. If this option is disabled, the text will be searched for inside long words as well.
Direction - the direction of searching for the text •Forward - search from the current position to the end of the file; •Backward - search from the current position to the beginning of the file.
Scope - the scope of data to be searched is specified here
•Global - search all data packets for the text (starting from the start position); •Selected - search only selected data packets for the text.
Origin - the start position is specified here
•From cursor - search from the cursor position; •Entire scope - search all data in the window.
After you click the OK button, the program will try to find the specified text. If it finds the text, the focus in the Monitor window will be moved to the found data packet and the found text will be highlighted in the color specified in the Program options. To find the next match, you should press F3. If no text has been found, the corresponding message will be displayed.
Edit | Find next (F3) - search further with the same parameters.
Edit | Properties - the command open Program options dialog box. View menuView | Show connected devices only - this option enables/disabled displaying only connected devices in the USB devices window. It means that if this option is enabled, USB ports without any devices connected to them will not be displayed in the USB devices window.
View | Hide host controllers without devices - this option becomes available only if the previous option is disabled and enables/disables displaying host controllers without any devices connected to them in the USB devices window. It means that if this option is enabled, host controllers without any devices connected to them will not be displayed in the USB devices window.
View | Auto refresh the USB devices tree - this option enables/disables automatically refreshing the list of devices in the USB devices window when you connect or disconnect USB devices. If the option is enabled, the list will be refreshed in a few seconds after a USB device is connected and completely initialized and ready. If this option is disabled, you will have to click the "Refresh" button in the USB devices window.
View | Auto scroll - this option enables/disables automatically scrolling the Monitor window when new data is received. When the option is enabled, the focus in the Monitor window will be automatically moved to the new data packet as soon as it is added to the Monitoring window. If the option is disabled, the focus in the Monitor window will remain unchanged.
View | Toolbars - this submenu allows you to enable/disable additional toolbars in the main window of the program.
View | Toolbars | Taskbar - the command enables/disables the taskbar in the main window of the program.
View | Toolbars | Status bar - the command enables/disables the status bar in the main window of the program.
Tools menuTools | Open the monitor window - the command opens the Monitor window with the default parameters.
Tools | Open the waiting monitor window - the command opens the Monitor window that will be waiting for a new device to be connected. AS soon as the device is connected, the program will automatically start capturing data from this device.
Tools | Open the performance monitor window - the command opens the Performance monitor window with the default parameters.
Tools | Show details - the command opens the USB device details window.
Tools | Replug the device fast - the program reinitializes the device on the software level, which is the same as safe disconnection it from the computer and then connection to it again. You may need it if you want to capture data that the computer and the device exchange when the USB device is being initialized or if you have changed the filter driver of Advanced USB Port Monitor for some reason.
Tools | Save as a Microsoft Word document - this menu item becomes available only if some information window is currently active (USB device details, information about URB, etc.) and allows you to save the report in the Microsoft Word document format. If you select this item, you will see a dialog box where you will have to specify the file name.
Tools | Save as a PDF file - this menu item becomes available only if some information window is currently active (USB device details, information about URB, etc.) and allows you to save the report in the Adobe PDF format. If you select this item, you will see a dialog box where you will have to specify the file name.
Tools | Export to an XML - this menu item becomes available only if the Monitor window is currently active and allows you to export data from the Monitor window to an XML file. This command is similar to the File | Save command except that you can save data only to an XML file.
Advanced features - commands for working with the driver allow you to specify driver configuration parameters. You may need it when you want to remove the driver from the system, reinstall it in the system or disable it for some device.
Tools | Install the driver service - the command installs the driver onto your system. Everything necessary for the normal functioning of the driver as a filter driver is done.
Tools | Remove the driver service - the command removes installation information about the driver from your system. This command does not remove information about installed filter drivers. That is why it may result in your USB device not working. Before you select this command, it is recommended to make sure that the filter driver is removed for all USB devices. To do it, you should right-click each USB device and host controller and make sure that the Remove the class filter driver and Remove the device filter driver items are not available.
Tools | Install the class filter driver - the command becomes available if a USB device, a hub or a host controller is selected in the USB devices window while no other filter driver is installed for devices and enables the filter driver for all USB devices on your system. This is how the filter driver is installed when you are installing the program and we recommend that most users use it this way. A minor disadvantage of this method is that the work of the filter driver affects (though a little bit) the work of all USB devices. After you select this command, you should restart the computer to enable the driver.
Tools | Remove the class filter driver - the command becomes available if a USB device, a hub or a host controller is selected in the USB devices window while the class filter driver is installed for devices and removes the class filter driver for all USB devices on your system. You may need this command if you want to use the filter driver separately for each USB device. After you select this command, you should restart the computer to enable the driver.
Tools | Install the device filter driver - the command becomes available if a connected USB device is selected in the list of USB devices while no filter driver of other type is installed and enables the filter driver for this USB device. If the filter driver is installed this way, its work affects only this device. The disadvantage of this method is that the driver has to be installed for each new device or in case your USB device has been connected to another USB port. After you select this command, you should reconnect the USB device to enable the driver. You can use the Tools | Replug the device fast command to avoid reconnecting the USB device manually.
Tools | Remove the device filter driver - the command becomes available if a connected USB device is selected in the list of USB devices while no filter driver of this type is installed and removes the filter driver for this USB device. After you select this command, you should reconnect the USB device to enable the driver. You can use the Tools | Replug the device fast command to avoid reconnecting the USB device manually.
Window menuWindow | USB devices - the command shows/hides the USB devices window.
Window | Cascade - the command cascades all child windows.
Window | Tile vertically - the command evenly tiles all child windows vertically.
Window | Tile horizontally - the command evenly tiles all child windows horizontally.
Window | Minimize all - the command minimizes all child windows.
Window | Arrange icons - the command arranges all minimized child windows in order at the bottom of the window. Help menuHelp | Content - the command opens the table of contents of the help file.
Help | Tip of the day - the command opens the Tip of the Day dialog box that is displayed after the program is started for the first time.
Help | About - the command opens the "About" dialog box where you can see the version of the program and your registration name.
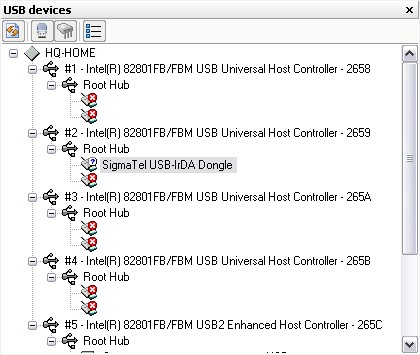
Help | Registration online - the command starts the browser using the program registration link. USB devices windowThe USB devices window (fig.1) shows the topology of all connected USB devices in the form of a tree. The program uses system functions to get text descriptions displayed in the tree. Generally, these descriptions are defined by the developer of drivers for each device. That is why the descriptions of standard devices (host controllers, hubs, etc.) may be localized depending on the localization of your Windows version.
Fig.1 USB devices window
The program determines the type of each device and uses the corresponding icons to display USB devices:
At the top of the tree you can see a toolbar with buttons you can use to quickly change the way the tree is displayed. Below you will find the names of the buttons and their functions from left to right:
Refresh - refreshes the list of USB devices. In case the View | Auto refresh USBs tree option is disabled, you can use this button to refresh the tree of devices manually.
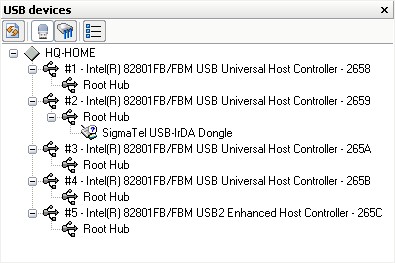
Show connected devices only - the command is similar to the corresponding command in the View menu. This option enables/disables displaying only connected devices. It means that if this option is enabled, USB ports without any devices connected to them will not be displayed in the USB devices window (fig.2).
Fig.2 The USB devices window with hidden USB ports
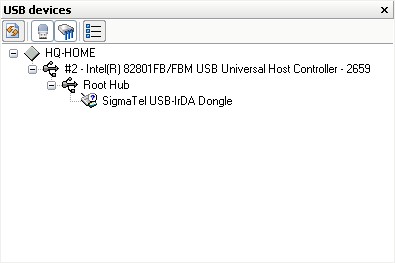
Hide host controllers without devices - this option becomes available only if the previous option is disabled and enables/disables displaying host controllers without any devices connected to them. It means that if this option is enabled, host controllers without any devices connected to them will not be displayed in the USB devices window (fig.3).
Fig.3 The USB devices window with hidden host controllers
Show device details - this command is similar to the Tools | Show details command and displays a window with detailed information about the USB device.
You can see brief information about a device if you move the mouse pointer to the device you need and hold the pointer over it for some time. You will see a tooltip with the main data about the device. Status bar and taskbarBy default, the taskbar is located in the lower part of the main window (fig.1), while the status bar is located at the bottom of the main window.
Taskbar
Fig.1. Taskbar
The taskbar is used to quickly switch between open windows. Since child windows can overlap, it happens to be much easier to click the title of a window than to search for it among windows located on the workspace in order to open it. The taskbar contains buttons with the titles of all open child windows. The active window is indicated by the pressed button. If the title of a window is too long, only first 30 characters of the title are displayed. You can see the full title of such a window on the status bar if you move the mouse pointer to the corresponding button. To switch to another window, just click the button with the title you need.
Status barIt shows a hint for each interface element when the mouse pointer is over it or in some cases shows the progress of some operation.
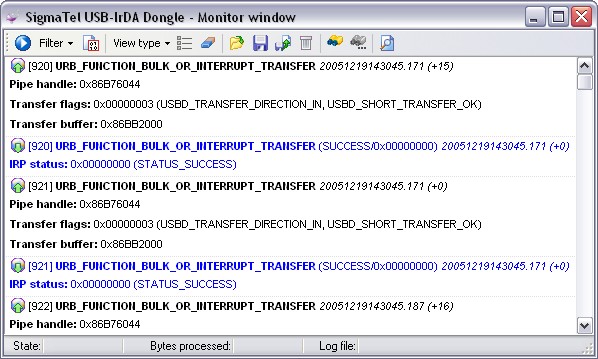
How to hide the status bar and the taskbarTo show or hide the taskbar or the status bar, you should click the corresponding item in the View | Toolbars menu. Hidden items allow you to use more space for the workspace and for other data. Monitor windowThe monitor window displays data the filter driver captures for the selected device (fig.1). You can open this window using any of the methods described in the "User interface" section.
Fig.1 Monitor window
The data window contains the following interface elements:
Toolbar - contains buttons for executing commands used to control data in the data window. The functions of these buttons are enumerated below (left to right):
Start/Stop monitoring - start/stop capturing data. If this button is not available, the Monitor window is waiting for the device to be connected (you used the Open waiting monitor window command) or you have opened the window for a non-existing device (for example, by opening a workspace). Before the program start capturing data, it checks that the filter driver is correctly installed and displays the corresponding message if necessary.
Filter - this submenu allows you to filter out data that you do not need to displayed. The filter parameters are passed to the filter driver and considerably influence the performance of the program. When you open this window, the filter parameters are set to the default values specified in the Program options dialog box. You can change the filter parameters for this window at any moment without modifying the default filter parameters. For your convenience, you can create several sets of filters and apply them when necessary. You can read about filter parameters here.
Write data to a binary log file - this option enables/disables writing data automatically to a binary log file. If it turns out that no log file name is specified when you enable writing data to a binary log, you will see the corresponding dialog box where you will have to enter the name of the log file.
View type - the way data is displayed in the data window. There are 3 data views predefined in the program.
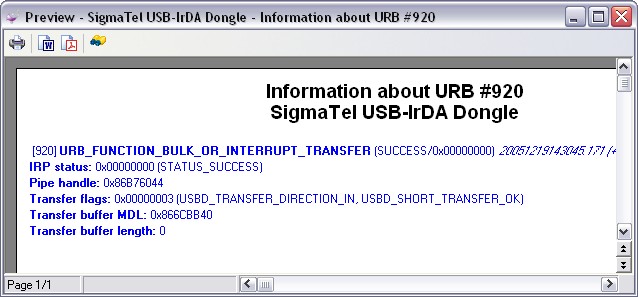
Show details about the URB - if the current data view does not allow you to see the entire information about URB, you can view it by clicking this button. It will open a new Information about URB window where you will see the entire information about the data packet (fig.2).
Fig.2 Full information about URB
Clear data on the screen - this button allows you to clear the data window.
Open a binary log file - this button allows you to open an existing binary log file and, if you want, set it as the current log file that will be used to automatically write captured data. When you execute this command, you will see a dialog box where you are to enter the file name and that checks if the header of the binary file corresponds to the device the Monitor window is open for. In case the headers do not match, you will see a warning message.
Save data to a binary log file - this button allows you to specify a new log file to automatically write captured data to or to save all or part of data to a new file and it is similar to the File | Save command.
Copy all data to another binary file - this button allows you to save all or part of data to another log file or XML file and is similar to the File | Save as command. To save part of data, you should select two or more data packets in the data window.
Delete the current log file - this button allows you to delete the current log file and all data in it.
Find - this button is similar to the Edit | Find command.
Find next - this button is similar to the Edit | Find next command.
Print preview - this button allows you to print information from the data window using the printer. When you use this command, a new information window will be opened. It will display information about all data packets or about only those that are selected. The current data view will be used to display the information.
Data window - displays captured data depending on the selected data view. When you move the mouse pointer to key words in the description (function names, text in bold type, pipe handles), you will see a tooltip for this word under the pointer.
Status bar - located at the bottom of the Monitor window and shows its status.
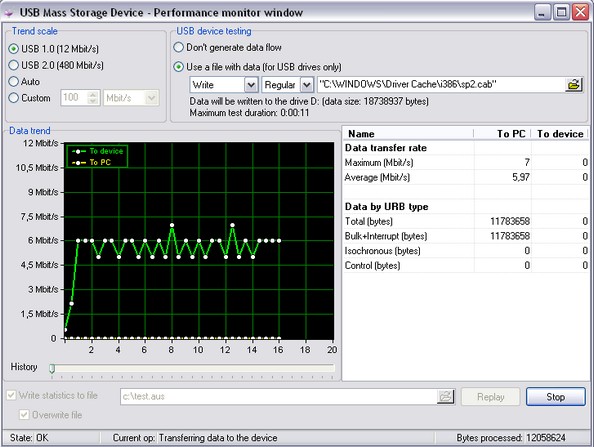
•State - the current state of the Monitor window (OK - data is being captured, Disabled - an error while starting capturing data); •Bytes processed - the number of bytes processed in each data packet. Changes in this field indicate the presence of a data flow; •Log file - indicates whether there is a binary log file and if data is automatically written to this log file (enabled/disabled). Performance monitor windowThe Performance monitor window allows you to evaluate the parameters of the data flow that you device generates or can generate (fig.1). You can open this window using any of the methods described in the "User interface" section.
Fig.1 Performance monitor window
This window contains the following interface elements:
Trend scale - this group of radio buttons allows you to select the maximum value for the Y axis on the performance graph. If you select the "Auto" option, the maximum value will be calculated automatically when new data is added to the performance graph.
Data trend - displays the performance graph for the selected device, where the X axis shows time passed since the beginning of the test (in seconds) and the Y axis shows the rate of data flow in bytes/sec, KB/sec or MB/sec. You can do some simple things with the graph:
•Zoom in part of the graph. To do it, use your mouse to select the part of the graph that you want to zoom in while holding down the left Shift key. A double-click on the graph while you are holding down the Shift key restores the graph to its original state. •Move the graph. It is necessary in order to see the invisible parts of the graph. To do it, scroll the graph to the point you need while holding down the Ctrl key together with the left mouse key on the graph. •Increase the time interval displayed on the graph. You should use the slider under the graph.
USB device testing - use this group of options to specify the parameters of testing the USB device.
Don't generate a data flow - generally the program cannot generate a data flow to evaluate the maximum performance of a USB device. The program just collects statistical data about the transferred amount of information within a time unit. That is why this option is selected for all USB devices.
Use a file with data - However, in case of USB drives, the program can launch the operation of copying, which the same as generating a data flow to the device and in the opposite direction. That is why the program determines the class of the USB device when you open this window. If the class of the device corresponds to a USB drive, the program tries to find the driver letter assigned by the device manager to this USB device. If the above mentioned operations have been successfully carried out, additional options become available.
Data direction mode - you can use this drop-down list to select the data transfer direction to be tested. •Write - writing data to the USB drive; •Read - reading data from the USB drive.
Transfer method - you can use this drop-down list to select the type of copying that will be used to generate a data flow. •Regular - this method uses the Windows system copy operation that uses caching and buffering. It suits better a synthetic test determining the maximum write/read rate. This rate will be achieved only while copying files of large size (several megabytes); •RAW - this method uses the internal copy operation that does not use caching and buffering. The data exchange rate measured during this test will be close to the rate of your work with this drive in any office application.
File name - this field is used to specify the name of the file that will be used to generate a data flow. If the file with the specified name exists on the disk, the minimal test duration will be automatically calculated. The maximum data transfer rate of the device interface and the file size will be used for calculation. If reading from an USB drive is tested, the file must be located on the USB drive, otherwise the file must be located on the local drive of the computer.
Data table - this table displays the statistical data collected during the last test for both data transfer directions (to the USB device and otherwise).
Data transfer rate•Maximum - the maximum data transfer rate of the interface during the text; •Average - the average data transfer rate of the interface during the test.
Data by URB type - the amount of data transferred with URB of various types during the test •Total - the total number of bytes (i.e. the number of bytes transferred with all URB types); •Bulk+Interrupt - the number of bytes transferred with the URB_FUNCTION_BULK_OR_INTERRUPT_TRANSFER function (it is usually used to transfer small data blocks, for instance, for sending its status to the computer by the USB device or for moving a large amount of data to the device or from it); •Isochronous - the number of bytes transferred with the URB_FUNCTION_ISOCH_TRANSFER function (a special method of sending streaming data to a USB device or from it, for instance, a USB camcorder with its digital video stream or a sound card with its digital audio stream); •Control - the number of bytes transferred with the URB_FUNCTION_CONTROL_TRANSFER function (it is usually used to transfer small data blocks, for instance, when a USB device sends its status to the computer).
The group of interface elements for writing statistics to a file - allows you to write statistical data to a file for further analysis. Next time you open this window, you will be able to load the performance graph and statistical values from a file by specifying it in the "Write statistics to a file" field and clicking the "Replay" button. If you need to create a statistics file, you should specify the name of the statistics file and select the "Write statistics to a file" checkbox. If you need to keep the statistical data that can be in the specified file, you should clear the "Overwrite the file" checkbox.
Status bar - shows the status of the Performance monitor window.
•State - the current state of the Performance monitor window (OK - data is being captured, Disabled - an error while starting capturing data); •Current op(eration) - when you are testing a USB device, it shows the current direction of copying data (writing or reading); •Bytes processed - the number of bytes processed in the USB drive test mode.
In order to start testing the performance, you should click the "Start" button. Before starting the test, the program will check the location and presence of the file with test data (if required). In case of an error, you will see the corresponding message.
If generating a data flow is enabled in the Performance monitor window options, starting a test will launch copying the data file to the USB device or from it and the test will be automatically finished after the file has been copied.
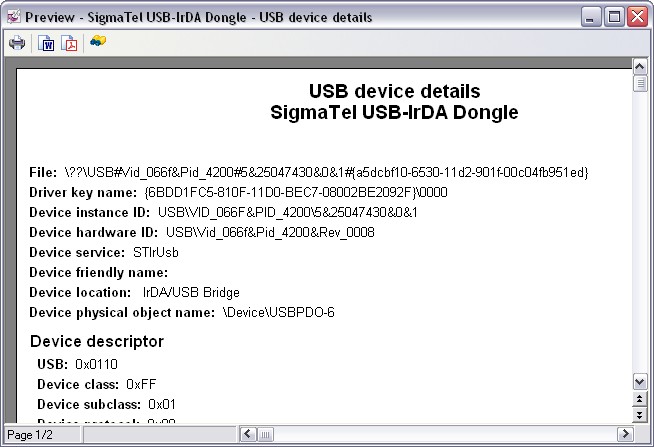
If no data flow is generated, you should finish the test by clicking the "Stop" button. USB device details windowThe USB device details window displays all additional and detailed information in a unified report-like style (technical information about the devices, information about URB, etc.) (fig.1). You can open this window using any of the methods described in the "User interface" section.
Fig.1 USB device details window
This window contains the following interface elements:
Toolbar - contains buttons for quick access to the functions of this window.
Print - a click on this button print the contents of the preview window with the current print settings. The command is similar to the File | Print command. You can use the File | Print setup menu item to configure the print settings.
Save as a Microsoft Word document - the command allows you to save the report in the Microsoft Word document format. If you select this item, you will see a dialog box where you will have to specify the file name. The command is similar to the Tools | Save as a Microsoft Word document command.
Save as a PDF file - the command allows you to save the report in the Adobe PDF format. If you select this item, you will see a dialog box where you will have to specify the file name. The command is similar to the Tools | Save as a PDF file command.
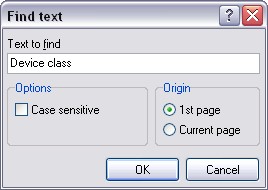
Find - this command allows you to search for text in the Preview window. After you select this command, you will see a dialog box (fig.2) where you can specify search parameters.
Fig.2 Search parameters dialog box
Text to find - the text that is to be found;
Options - here you specify the parameters of the search string
•Case sensitive - take into account the difference between lowercase and uppercase letters while searching.
Origin - the start position is specified here
•1st page - start searching from the first page; •Current page - search only the current page.
After you click the OK button, the program will try to find the specified text. If the text is found, the focus in the Monitor window will be moved to the found text.
Preview window - allows you to view the requested information, for example, before you print it. A right-click on the preview window opens a context menu allowing you to select the most convenient form of data presentation.
200% - 10% - you can select the scale of the data report. By default, the scale is 100%, which corresponds to the actual size of the report.
Page width - the page width will be automatically selected in accordance with the width of the information window. Whole page - the page width and height will be automatically selected in accordance with the width of the information window. Two pages - the same as Whole page, but two pages will be displayed next to each other. WorkspaceBefore exiting the program, you can save the configuration of your workspace during the current session of working with the program. It allows you to easily save your settings between sessions. You can create, delete and save workspaces manually.
Advanced USB Port Monitor has three types of workspaces:
Default workspace - this workspace is loaded after you start the program for the first time and if you have not loaded any custom workspaces. This workspace type saves only information about the position of the main window and the position of interface elements in the main window of the program.
Custom workspaces in internal storage - these are workspaces you created and saved under some names. A workspace created once stores all the settings of the program, including the position of all child windows and their parameters active at the moment of creating or saving the workspace. When you load a workspace, all default workspace parameters are overridden. Workspaces of this type are stored in the Workspaces subfolder of the program folder.
Custom workspaces in file - it is the same as Custom workspaces in internal storage, except that data about such a workspace is stored in a separate file on your disk and it is not displayed in the dialog box when you use the File | Open a workspace command.
Creating, loading and saving a workspaceUse the following command line parameters and menu items to manage workspaces:
If the name of a workspace file (with the auw extension) is specified in the command line, the specified workspace will be loaded when the program is started.
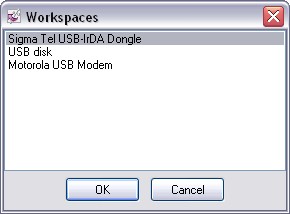
File | Open a workspace - the command opens the dialog box (fig.1) with the list of workspaces. This dialog box shows only workspaces stored in the internal storage and does not include workspaces saved to files with the File | Save the workspace to a file command.
Fig.1 Workspaces dialog box
To load a workspace, you should select it from the list and click the OK button. After that the selected workspace will be loaded. You may see warning messages during the process of loading the workspace if the workspace contains child window for a device that is not connected. Such a window will be created, but its functionality will be limited until you connect the corresponding device.
File | Save the workspace - the command becomes available only if some workspace is loaded and allows you to save all changes made in the workspace after it has been loaded.
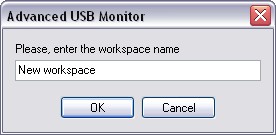
File | Save the workspace as - the command allows you to save the workspace under a new name. When you select this command, you will see a dialog box offering you to enter the name of the workspace (fig.2). After you click the OK button in this dialog box, the workspace name will be checked for invalid characters (you cannot use invalid characters in file names) and the workspace will be saved to the internal storage with the specified name.
Fig.2 Dialog box for entering the workspace name
File | Delete workspaces - the command opens the dialog box (fig.1) with the list of workspaces that you can delete. Unlike in the dialog box of the File | Open a workspace command, you can select several workspaces that should be deleted.
File | Open a workspace from a file - the command opens the dialog box where you can select any file with a workspace on the disk. It is the same as the File | Open a workspace command, except that you will see the Windows standard Open File dialog box.
File | Save the workspace to a file - the command opens the dialog box where you can specify the path and the name of the file to save the workspace to on the disk.
File | Open the last workspace on startup - this option specifies that next time the program is started, the last active workspace should be loaded. If no workspace has been used yet, the option is ignored when the program is started. If you specify the name of a workspace file as a command line parameter, this option is ignored.
Workspace contents
Workspace information is used aggregately: The default workspace is loaded first and then the parameters of the custom workspace complement or override it. Each custom workspace stores the following information about the last session:
•Data about the position of the main program window; •Data about the positions and sizes of moveable interface elements in the main window of the program (menu, taskbar, etc.) •For each child window: 1.The identifiers of the device it was opened for; 2.The title of the open window; 3.Data about the position and the size of the window.
Additionally for each type of child windows
•Monitor windows:
1.Filter parameters; 2.Binary log file name; 3.Current data view; 4.The status of the "Save data to a binary log file" button.
•Performance monitor windows: 1.Performance graph scale; 2.The status of the "Write statistics to file" checkbox; 3.The status of the "Overwrite file" checkbox; 4.Statistics file name; 5.Performance test type; 6.The name of the file used for testing performance.
•Information windows: 1.Report contents
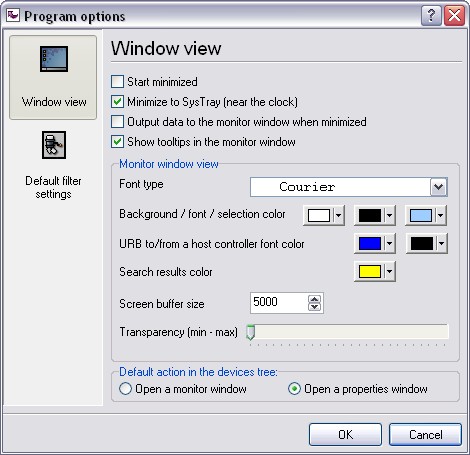
Program optionsThe program option in fig.1 allow you to customize the appearance of the main window of the program and the Monitor window.
Start minimized - if this option is enabled, the main window of the program will appear not on the desktop, but only on the taskbar or in the SysTray when you start the program.
Minimize to SysTray - if this option is enabled, the program will place its icon on the bar next to the clock (SysTray) when you minimize the main window of the program instead of placing its icon on the Windows taskbar.
Output data to the monitor window when minimized - if this option is disabled, data will not be added to the Monitor window when the main window of the program or the Monitor window is minimized. It considerably reduces the processor load when you are not working with the program or with some Monitor window.
Show tooltips in the monitor window - this option enables/disables tooltips in the Monitor window (see fig.1 item. [5] in the "User interface" section).
The "Monitor window view" group of interface elements - allows you to customize the appearance of the Monitor window.
Font type - the font type that will be used to display data in the Monitor window.
Background/font/selection color - this group of interface elements defines the background color, the font color and the color of the selected items in the data window of the Monitor window (see fig.1 in the "Monitor window" section).
URB to/from a host controller font color - this group of interface elements defines the font color of data sent to the host controller and from it respectively (see fig.1 in the "Monitor window" section).
Search results color - this interface element defines the color the found text will be highlighted in during a search.
Screen buffer size - the screen buffer size defines the number of packets stored in the Monitor window. If the number of packets in the Monitor window exceeds the specified value when a new data packet is added to it, the oldest data packet is removed from the Monitor window. The greater the specified value is, the more memory the program will require to run normally because each data packet requires a certain number of bytes.
Transparency - defines the transparency of the main window and all child windows. You may need it when you want to see the desktop covered by the window of the program.
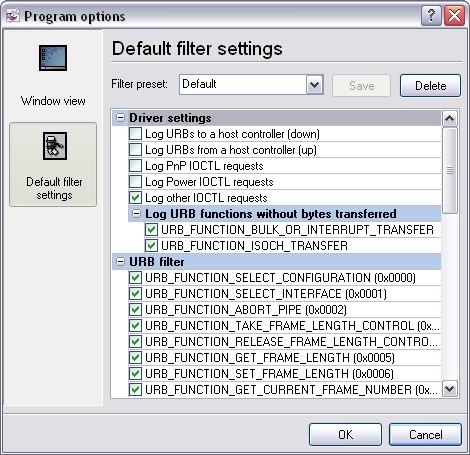
The program options in fig.2 allow you to create one or several predefined filters that you can quickly load later using the Filter menu in the Monitor window. So when you open the Monitor window, the filter selected in the "Filter preset" field will be automatically set for it.
Fig.2 Default filter configuration
Creating a filter1.You should select one of the filters in the "Filter preset" list that you want to use as the basis for a new filter; 2.Change the filter parameters if necessary; 3.Specify a new name in the "Filter preset" field; 4.Save the filter by clicking the "Save" button; 5.Select one of the filters in the "Filter preset" list you want to use by default.
Editing a filter1.You should select the filter you want to edit in the "Filter preset" list; 2.Change the filter parameters if necessary; 3.Save the filter by clicking the "Save" button; 4.Select one of the filters in the "Filter preset" list you want to use by default.
Deleting a filter1.You should select the filter you want to delete in the "Filter preset" list; 2.Click the "Delete" button and confirm that you want to delete the filter; 3.Select one of the filters in the "Filter preset" list you want to use by default.
Filter parametersFilter parameters are divided into several groups:
General filter parameters in the "Driver settings" group
Log URBs to a host controller (down) - if this filter parameter is enabled, the driver will capture data packets sent to the host controller.
Log URBs to a host controller (up) - if this filter parameter is enabled, the driver will capture data packets sent from the host controller.
Log PnP IOCTL requests - if this filter parameter is enabled, the driver will capture PnP system packets with major control code = IRP_MJ_PNP.
Log Power IOCTL requests - if this filter parameter is enabled, the driver will capture packets with major control code = IRP_MJ_POWER.
Log other IOCTL requests - if this filter parameter is enabled, the driver will capture packets with the major control code like IRP_MJ_CREATE, IRP_MJ_CLOSE, IRP_MJ_CLEANUP, etc.
Filter by the URB request name - this group of options allows you to set a filter for each URB function that can be sent to the host controller and from it. You may need it when you are interested in a certain part of data exchange between the device and the computer, for example, the initialization moment when the descriptor request functions are transferred. You can find more detailed information in the Microsoft Windows Driver Development Kit documentation. How to view technical information about a deviceDo you want to look through technical information about a USB device present in the list of USB devices in Advanced USB Port Monitor? Use one of the three methods described in the "User interface" section to open the USB device details window. How to capture dataDo you want to look through data and data packets your computer and USB device exchange between each other?
Step 1.To be able to capture data, make sure the following three conditions are observed:
1.Your device must be connected to a USB port. If the device is not connected yet, connect it now to any available USB port; 2.Your device must be correctly initialized and installed in Windows. If the device is not recognized or initialized in Windows (the icon of the device in the list of devices in the program is either 3.Our filter driver must be installed for your device, either as the class filter or as the device filter. If you have not done anything with the driver after its installation (and have not forgotten to restart the computer after you installed the program), you do not need to do anything. Otherwise use the driver control commands to install it in the system.
Step 2.Use one of the three methods described in the "User interface" section to open the Monitor window.
Step 3.Use the "Filter" button to specify your custom filter parameters. If you do not know what filter parameters mean, it is recommended to enable all the options.
Step 4.If you want to create a log file with captured data, click the
Step 5.Click the "Start"
•Make sure all conditions in step 1 are observed. •Make sure all filter options are enabled. •Make sure your device sends or receives some data. Most USB devices are constantly informing the computer about their status. If your device is an exception, you should generate traffic for it. To do it, just use the device in a usual way (if it is a mouse, move it; if it is a sound card, play a sound via it; if it is a USB drive, write a file to the drive or read a file from it, etc.).
If you still cannot see any data, see the "Troubleshooting" section or contact our technical support service at support page.
How to capture data transferred by devices being connectedDo you want to look through data and data packets your computer and USB device exchange between each other when the USB device is being connected?
Step 1.To be able to capture data, make sure the following two conditions are observed:
1.Your device must be correctly recognized in Windows. If the device is not recognized (it is not in the list of devices in the program),you should contact the device manufacturer in order to get a new version of the driver or instructions on how to install the device. You may have to restart the computer; 2.Our filter driver must be installed for your device, either as the class filter or as the device filter. If you have not done anything with the driver after its installation (and have not forgotten to restart the computer after you installed the program), you do not need to do anything. Otherwise use the driver control commands to install it in the system.
Step 2.Unplug your USB device from the USB port.
Step 3.Use either method 1 or method 2 described in the "User interface" section to open the waiting Monitor window. This will open the Monitor window where the "Start"
Step 4.Use the "Filter" button to specify your custom filter parameters. If you do not know what filter parameters mean, it is recommended to enable all the options.
Step 5.If you want to create a log file with captured data, click the
Step 6.Connect your device to the same USB port you unplugged it from. After Windows finds the device and it appears in the list of USB devices, the "Start" button
Click the "Start"
•Make sure all conditions in step 1 are observed. •Make sure all filter options are enabled. •Make sure your device sends or receives some data. Most USB devices are constantly informing the computer about their status. If your device is an exception, you should generate traffic for it. To do it, just use the device in a usual way (if it is a mouse, move it; if it is a sound card, play a sound via it; if it is a USB drive, write a file to the drive or read a file from it, etc.).
If you still cannot see any data, see the "Troubleshooting" section or contact our technical support service at support page.
How to work with a log fileDo you want to look through data and data packets written to a binary log file earlier?
When you install the program, it gets registered in Windows and its shell so that you can double-click the name of a log file (with the aum extension) and this log file will be opened in the program. You can also open a log file using the File | Open command. After that the program will read the header of the log file and, if it detects that the log file was created for another USB device, warn you about it.
In the open window, you can do with the file the same that is described in the "Monitor window" section. Statistics file
The file will contain "Statistics data item" part for each URB with transferred data. You can read the file and calculate statistics for incoming and outgoing data. Known issuesThe program does not start - it may happen because the executable file of the program has been modified or it is being debugged. The running SoftIce debugger may be an indirect cause of it.
When I click the "Start" button, an error message is displayed in the Monitor window and no data is captured - an incorrectly installed filter driver causes it. Make sure that:
If the above methods do not help you solve your problem, try to: 1.remove the driver and its registration information from the system; 2.restart the computer; 3.reinstall the program; 4.execute the "Install the driver service" command; 5.execute the "Install the class filter driver" command; 6.restart the computer.
If an error occurs while you are trying to register or install the driver for the second time, contact us and let us know the error text in order to get personal recommendations.
When I click the "Start" button, there is no error message in the Monitor window, but no data is captured - it happens because no driver has been installed for your USB device or your USB device does not belong to the class of USB devices supported by Windows. Generally, it is enough to restart the computer. If it does not help perform actions described in the previous problem.
A certainly operating USB device has the FAQQ: How does the filter driver influence the device? A: Our driver fully complies with the WDM filter driver specification and correctly processes all types of requests that can go through it. While running, it spends only the time necessary to buffer data. It is really little time compared to the time of a request to an USB device. That is why it does not influence the device.
Q: Can the filter driver damage data transferred to the device or from it? A: Theoretically, everything is possible. In practice, our driver was tested with a debugger of the kernel level and we used such Microsoft testing tools as verifier and HCT 12.10 (Hardware Compatibility Test) under most stressful conditions, which excludes* failures in its work.
Q: Can the filter driver or the program damage data on the local disk? A: No.
Q: Are there any cables or additional devices required to capture data? A: Our software run on the software level and does not depend on cables. No special or additional devices are required for our program to run.
Q: Why do you use the filter driver while there are applications that run without it and perform the same operations? A: Our software uses only documented and recommended by Microsoft company technologies only. We do not use technologies, the patch method in particular (when functions located in one kernel driver are substituted with other functions located in another driver), based on undocumented and dangerous methods that may lead to failures in the work of the operating system and in particular USB devices and at the same time have absolutely no advantages concerning the functionality and performance.
|
|||||||||||||||||||||||||||||||||||||||||||||||||||||||||||||||||||||||||||||||||||||||||||||||||||||||||||||||||||