The Performance monitor window allows you to evaluate the parameters of the data flow that you device generates or can generate (fig.1). You can open this window using any of the methods described in the "User interface" section.
|
Note: It is not recommended to capture data in the Montor window simultaneously with the performance test, because it can have influence on the results of the latter. Before a performance test, please stop capturing data in the Monitor window.
|
|
Note: It is not recommended to open two performance monitor windows for one device because it may lead to unforeseen consequences.
|
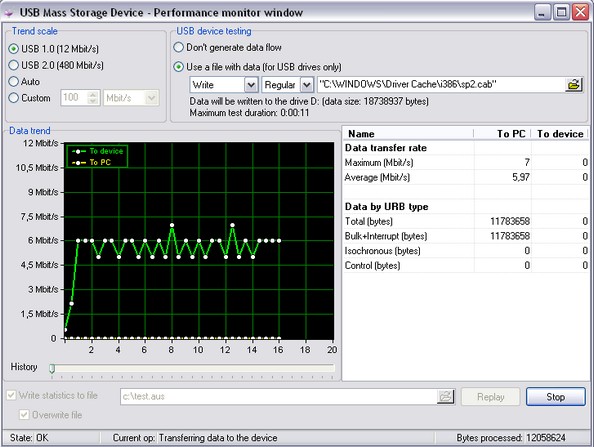
Fig.1 Performance monitor window
This window contains the following interface elements:
Trend scale - this group of radio buttons allows you to select the maximum value for the Y axis on the performance graph. If you select the "Auto" option, the maximum value will be calculated automatically when new data is added to the performance graph.
Data trend - displays the performance graph for the selected device, where the X axis shows time passed since the beginning of the test (in seconds) and the Y axis shows the rate of data flow in bytes/sec, KB/sec or MB/sec. You can do some simple things with the graph:
•Zoom in part of the graph. To do it, use your mouse to select the part of the graph that you want to zoom in while holding down the left Shift key. A double-click on the graph while you are holding down the Shift key restores the graph to its original state.
•Move the graph. It is necessary in order to see the invisible parts of the graph. To do it, scroll the graph to the point you need while holding down the Ctrl key together with the left mouse key on the graph.
•Increase the time interval displayed on the graph. You should use the slider under the graph.
USB device testing - use this group of options to specify the parameters of testing the USB device.
Don't generate a data flow - generally the program cannot generate a data flow to evaluate the maximum performance of a USB device. The program just collects statistical data about the transferred amount of information within a time unit. That is why this option is selected for all USB devices.
Use a file with data - However, in case of USB drives, the program can launch the operation of copying, which the same as generating a data flow to the device and in the opposite direction. That is why the program determines the class of the USB device when you open this window. If the class of the device corresponds to a USB drive, the program tries to find the driver letter assigned by the device manager to this USB device. If the above mentioned operations have been successfully carried out, additional options become available.
Data direction mode - you can use this drop-down list to select the data transfer direction to be tested.
•Write - writing data to the USB drive;
•Read - reading data from the USB drive.
Transfer method - you can use this drop-down list to select the type of copying that will be used to generate a data flow.
•Regular - this method uses the Windows system copy operation that uses caching and buffering. It suits better a synthetic test determining the maximum write/read rate. This rate will be achieved only while copying files of large size (several megabytes);
•RAW - this method uses the internal copy operation that does not use caching and buffering. The data exchange rate measured during this test will be close to the rate of your work with this drive in any office application.
File name - this field is used to specify the name of the file that will be used to generate a data flow. If the file with the specified name exists on the disk, the minimal test duration will be automatically calculated. The maximum data transfer rate of the device interface and the file size will be used for calculation. If reading from an USB drive is tested, the file must be located on the USB drive, otherwise the file must be located on the local drive of the computer.
|
Note: It is not recommended to specify the name of the file for testing on the same USB drive that you want to test because it will distort test results due to information that will be copied from the drive or to the drive.
|
Data table - this table displays the statistical data collected during the last test for both data transfer directions (to the USB device and otherwise).
Data transfer rate
•Maximum - the maximum data transfer rate of the interface during the text;
•Average - the average data transfer rate of the interface during the test.
Data by URB type - the amount of data transferred with URB of various types during the test
•Total - the total number of bytes (i.e. the number of bytes transferred with all URB types);
•Bulk+Interrupt - the number of bytes transferred with the URB_FUNCTION_BULK_OR_INTERRUPT_TRANSFER function (it is usually used to transfer small data blocks, for instance, for sending its status to the computer by the USB device or for moving a large amount of data to the device or from it);
•Isochronous - the number of bytes transferred with the URB_FUNCTION_ISOCH_TRANSFER function (a special method of sending streaming data to a USB device or from it, for instance, a USB camcorder with its digital video stream or a sound card with its digital audio stream);
•Control - the number of bytes transferred with the URB_FUNCTION_CONTROL_TRANSFER function (it is usually used to transfer small data blocks, for instance, when a USB device sends its status to the computer).
The group of interface elements for writing statistics to a file - allows you to write statistical data to a file for further analysis. Next time you open this window, you will be able to load the performance graph and statistical values from a file by specifying it in the "Write statistics to a file" field and clicking the "Replay" button. If you need to create a statistics file, you should specify the name of the statistics file and select the "Write statistics to a file" checkbox. If you need to keep the statistical data that can be in the specified file, you should clear the "Overwrite the file" checkbox.
Status bar - shows the status of the Performance monitor window.
•State - the current state of the Performance monitor window (OK - data is being captured, Disabled - an error while starting capturing data);
•Current op(eration) - when you are testing a USB device, it shows the current direction of copying data (writing or reading);
•Bytes processed - the number of bytes processed in the USB drive test mode.
In order to start testing the performance, you should click the "Start" button. Before starting the test, the program will check the location and presence of the file with test data (if required). In case of an error, you will see the corresponding message.
If generating a data flow is enabled in the Performance monitor window options, starting a test will launch copying the data file to the USB device or from it and the test will be automatically finished after the file has been copied.
If no data flow is generated, you should finish the test by clicking the "Stop" button.